
Top Social Media Metrics to Track for Success in 2025
Discover the key social media metrics to track for boosting your performance. Get expert tips and insights to succeed in 2025!
Unlocking Social Media Success: The Metrics That Matter
Want to transform your social media presence from a guessing game into a results-driven machine? You need to track the right metrics. This listicle delivers 10 essential social media metrics to track in 2025, cutting through the noise and giving you actionable insights to optimize your strategy for real growth.
Measuring vanity metrics won't cut it anymore. We'll dive deep into the data points that actually correlate with business outcomes - from engagement and reach to conversions and ROI. This isn't just a list of definitions; we'll provide benchmarks, best practices, and practical examples to help you interpret the data and make smarter decisions.
Whether you're an e-commerce entrepreneur, a digital marketing agency, a social media manager, or a content creator, this guide will empower you to understand which social media metrics to track for maximum impact. We'll cover crucial topics like:
- Understanding Engagement Rate: Go beyond likes and comments to measure true audience interaction.
- Maximizing Reach and Impressions: Expand your brand's visibility and get your content seen by the right people.
- Boosting Click-Through Rate (CTR): Optimize your calls to action and drive traffic to your website or landing pages.
- Driving Conversions: Translate social media engagement into tangible business results like sales and leads.
- Calculating Social Media ROI: Prove the value of your social media efforts and secure further investment.
Ready to unlock the power of data-driven social media? Let's dive in.
1. Engagement Rate
Engagement rate is a crucial social media metric that reveals how effectively your content resonates with your audience and prompts interaction. It measures the level of interaction (likes, comments, shares, saves) relative to your reach or follower count. Calculating engagement rate involves dividing total engagement by reach or follower count, then multiplying by 100 to express it as a percentage. Tracking this metric helps you understand what content truly connects with your audience and drives meaningful actions.
Why focus on engagement? Because a high engagement rate signifies strong content performance and audience interest, leading to increased brand visibility and potentially higher conversion rates. For a more in-depth understanding of this powerful metric, explore this article on tracking social media engagement.
Examples of High Engagement
Several brands excel at driving high engagement rates. Netflix, for example, consistently achieves 3-5% engagement rates on Instagram with witty and relatable content. National Geographic maintains high engagement through breathtaking visual storytelling. Wendy's, known for its humorous and personality-driven Twitter presence, frequently sees engagement rates between 8-12%.
The following infographic provides a quick reference for calculating engagement rate and understanding industry benchmarks:
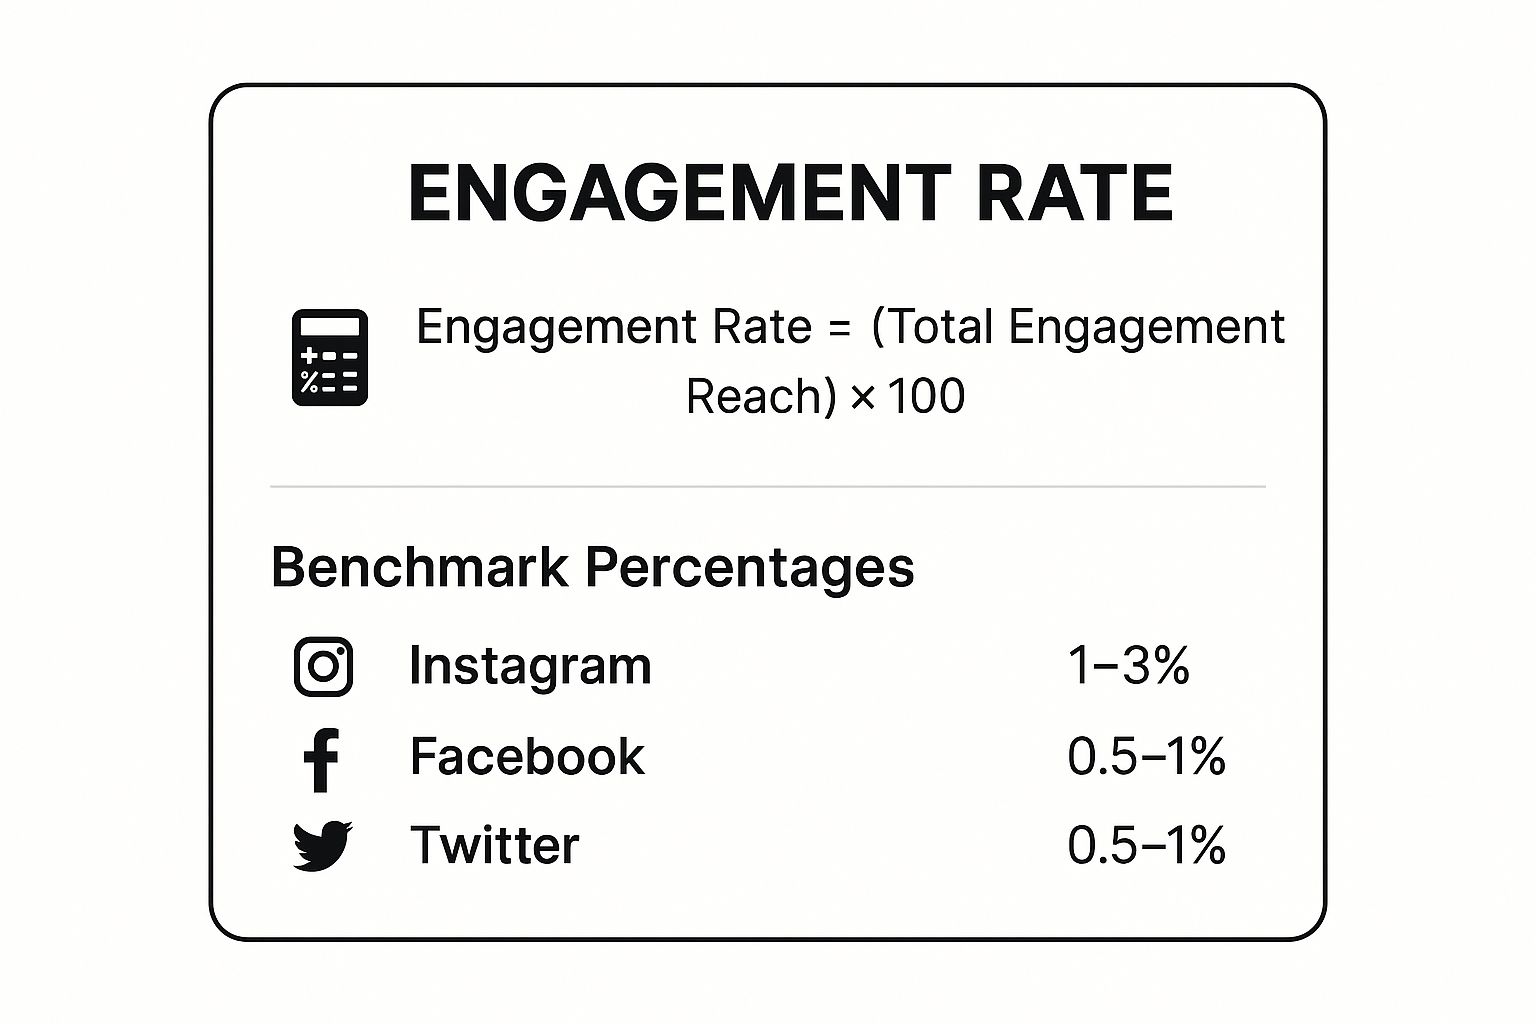
As the infographic shows, the formula is straightforward and benchmarks vary across platforms. Aiming for the higher end of these benchmarks signifies content that effectively connects with your target audience.
Tips for Improving Engagement Rate
- Track engagement by content type: Identify high-performing content formats to refine your content strategy.
- Post consistently during peak hours: Maximize visibility when your audience is most active.
- Respond to comments promptly: Foster a sense of community and encourage further interaction.
- Leverage interactive features: Utilize polls, questions, and stickers to actively engage your audience.
- Prioritize reach over followers: Using reach in your engagement rate calculation provides a more accurate measure of content performance.
By actively monitoring and strategically optimizing your engagement rate, you can significantly improve your social media performance and achieve your marketing goals.
2. Reach and Impressions
Reach and impressions are fundamental social media metrics to track, offering valuable insights into your content's visibility. Reach measures the number of unique users who see your content. Impressions, on the other hand, count the total number of times your content is displayed, including multiple views by the same user. Tracking these metrics helps you understand the potential audience exposure your content receives, forming the basis for analyzing other performance indicators.
Why focus on reach and impressions? These metrics reveal how widely your content is distributed and its potential for engagement. A large reach indicates broader brand awareness, while a high impression count suggests potential for repeated exposure and deeper engagement with your message. To effectively schedule your content for optimal reach and impressions, explore this article on social media content scheduling.
Examples of High Reach and Impressions
Many brands effectively leverage campaigns to achieve high reach and impressions. Coca-Cola's Christmas campaigns, for instance, regularly achieve over 50 million reach across various platforms. Super Bowl advertisers meticulously track reach to measure the effectiveness of their high-budget campaigns. Even local businesses benefit from these metrics, using reach to understand their penetration within the local community.
Tips for Improving Reach and Impressions
- Compare reach to impressions: This comparison helps you understand the replay value of your content. A large gap between impressions and reach suggests that users are viewing your content multiple times.
- Track reach trends over time: Identify growth patterns and pinpoint factors contributing to increased visibility.
- Use reach data to optimize posting times and frequency: Schedule content when your target audience is most active to maximize visibility.
- Segment reach by demographics: Refine your targeting strategies by understanding which segments of your audience are engaging with your content.
- Combine reach and impression data with engagement metrics: Gain a comprehensive understanding of content performance by analyzing reach, impressions, and engagement together. This combined analysis provides a holistic view of how your content is performing across various dimensions.
3. Click-Through Rate (CTR)
Click-through rate (CTR) measures the percentage of people who click on a specific link, call-to-action, or advertisement after seeing it. Calculated by dividing clicks by impressions and multiplying by 100, CTR is a critical metric for evaluating content effectiveness in driving traffic and measuring audience interest in taking desired actions. Tracking CTR helps you understand which social media content resonates most strongly with your audience and motivates them to take the next step.
Why focus on CTR? Because a high CTR signifies compelling content and effective targeting. This leads to increased website traffic, improved lead generation, and potentially higher conversion rates. Monitoring CTR provides valuable insights into audience preferences and helps refine your social media strategy for better results.
Examples of High CTR
Several brands excel at achieving high CTRs. HubSpot consistently achieves 2-3% CTR on LinkedIn ads through targeted B2B content. BuzzFeed historically achieved high CTRs with compelling headlines and thumbnails. Amazon's product recommendation emails maintain 3-5% CTRs through personalization.
Tips for Improving CTR
- A/B test headlines, images, and CTA buttons: Identify the most effective elements for maximizing click-throughs.
- Use compelling, benefit-focused language in link descriptions: Clearly communicate the value proposition to entice clicks.
- Ensure landing pages match the promise made in social content: Provide a seamless user experience to avoid bounce rates.
- Track CTR by content type: Identify the most effective formats for driving traffic.
- Monitor CTR trends: Identify declining content performance and adapt your strategy accordingly.
By actively monitoring and strategically optimizing your click-through rate, you can significantly improve your social media ROI and achieve your marketing goals.
4. Conversion Rate
Conversion rate is a crucial social media metric that measures the percentage of visitors who complete a desired action. These actions could include making a purchase, signing up for a newsletter, or downloading content. This metric directly ties social media efforts to tangible business outcomes. Calculating conversion rate involves dividing the number of conversions by the total social media traffic, then multiplying by 100. Tracking conversion rate is essential for understanding the effectiveness of your social media strategy in driving desired user behavior.
Why focus on conversion rate? Because it provides a clear measure of return on investment (ROI) for your social media marketing. A higher conversion rate indicates that your social media efforts are effectively driving valuable actions and contributing to business growth. This metric offers actionable insights to optimize campaigns and improve overall social media performance.
Examples of High Conversion Rates
Several brands demonstrate success in driving high conversion rates from social media. Shopify merchants, on average, achieve 1-2% conversion rates from social media traffic. Dollar Shave Club, known for its targeted social campaigns, has achieved impressive conversion rates of 12%. Airbnb leverages social proof and user-generated content to drive booking conversions between 3-5%.
Tips for Improving Conversion Rate
- Set up proper conversion tracking: Use UTM parameters to accurately attribute conversions to specific social media campaigns.
- Create platform-specific landing pages: Tailor landing pages to align with the specific social media platform driving traffic for a seamless user experience.
- Use retargeting campaigns: Reconnect with users who have interacted with your social media content but haven't converted.
- Test different offers and CTAs: Experiment with various offers and call-to-actions (CTAs) to optimize conversion performance.
- Track micro-conversions: Monitor smaller actions, such as email sign-ups, alongside macro-conversions like sales to gain a comprehensive view of user engagement.
By actively monitoring and optimizing your conversion rate, you can directly impact your business outcomes and maximize the value of your social media marketing efforts.
5. Social Share of Voice
Social share of voice (SSoV) measures how much of the online conversation about your industry or relevant topics mentions your brand compared to competitors. It helps you understand your brand visibility, market position, and the competitive landscape within social media discussions. Calculating SSoV involves dividing your brand mentions by the total industry mentions, expressed as a percentage. Tracking this metric helps gauge your brand's prominence relative to competitors and identify opportunities to increase your share of the conversation.
Why focus on SSoV? Because it provides crucial insights into your brand awareness and how effectively you're cutting through the noise. A higher SSoV can indicate stronger brand recognition, greater influence within your market, and potentially increased market share.
Examples of High Social Share of Voice
Several brands effectively maintain a high social share of voice. Nike, for instance, consistently achieves a 35-40% share of voice in athletic apparel social conversations. Tesla dominates electric vehicle social conversations, often holding a 60%+ share of voice. Starbucks typically maintains a 25-30% share of voice within coffee industry discussions on social media.
Tips for Improving Social Share of Voice
- Monitor SSoV trends: Focus on changes in share of voice over time, rather than fixating on absolute numbers. This helps identify emerging trends and competitive shifts.
- Identify key competitors and industry terms: Accurate measurement requires defining relevant competitors and tracking conversations around specific keywords related to your industry.
- Combine with sentiment analysis: Understanding the sentiment (positive, negative, neutral) associated with brand mentions provides a more complete picture of your competitive standing.
- Use SSoV data to identify content gaps and opportunities: Analyzing conversations can reveal topics and content formats that resonate with your target audience and provide opportunities to create engaging content.
- Track branded vs. non-branded keyword performance: Monitoring both types of keywords allows you to understand how effectively your brand is associated with relevant industry terms.
By actively monitoring and strategically working to improve your social share of voice, you can strengthen your brand presence, gain a competitive edge, and ultimately drive better business outcomes.
6. Customer Acquisition Cost (CAC) from Social Media
Customer Acquisition Cost (CAC) from social media calculates the total cost of acquiring a new customer through your social media channels. This includes advertising spend, content creation costs, and the resources allocated from your team. Tracking CAC is essential for understanding the financial efficiency of your social media marketing efforts. Calculate CAC by dividing your total social media costs by the number of customers acquired through those channels.
Why is understanding CAC so vital? Because it directly impacts your profitability. By monitoring and optimizing your social media CAC, you can ensure your marketing investments generate a positive return. A lower CAC signifies a more efficient customer acquisition process, allowing you to scale your business profitably.
Examples of CAC in Different Industries
Different industries experience varying CAC benchmarks from social media. SaaS companies typically see a CAC between $50 and $200, depending on their average contract value (ACV). E-commerce brands often achieve a CAC between $20 and $80 through Facebook and Instagram ads. B2B companies may have a higher CAC, ranging from $200 to $1000 or more, but they often benefit from higher customer lifetime values.
Tips for Improving CAC from Social Media
- Track both paid and organic social media costs: Include all expenses for a comprehensive CAC calculation.
- Compare CAC across different platforms: Identify the most cost-effective channels for customer acquisition.
- Include content creation, tools, and team salary costs: Factor in all resources dedicated to social media marketing.
- Monitor CAC trends over time: Spot inefficiencies and identify areas for improvement.
- Ensure CAC is significantly lower than Customer Lifetime Value (CLTV): This ensures your marketing efforts are profitable in the long run.
By diligently tracking and optimizing your social media CAC, you can gain valuable insights into the financial performance of your campaigns and drive sustainable business growth. Understanding this key metric allows you to make data-driven decisions and maximize the return on your social media marketing investments.
7. Follower Growth Rate
Follower growth rate is a key social media metric that tracks the speed at which your audience expands over a specific period, typically calculated as a percentage. This metric provides valuable insights into the effectiveness of your brand awareness campaigns, content strategy, and overall social media presence growth. Calculating follower growth rate involves dividing the number of new followers gained by the total followers at the beginning of the period, then multiplying by 100.
Tracking follower growth rate is essential for understanding how well your social media efforts are attracting new users and expanding your reach. A consistently positive growth rate indicates that your content resonates with your target audience and your strategies are driving audience expansion. This metric also helps assess the impact of specific campaigns or content types on follower acquisition.
Examples of Follower Growth
Different types of accounts experience varying follower growth rates. TikTok accounts, for instance, can achieve impressive 50-100%+ monthly growth with viral content. Established brands on platforms like Instagram or Facebook typically aim for a more sustainable 1-5% monthly follower growth. Influencers and content creators often see growth rates between 10-20% monthly, especially during peak campaign periods.
Tips for Improving Follower Growth Rate
- Focus on quality over quantity: Attract relevant followers who are genuinely interested in your brand or content, rather than simply maximizing numbers. A highly engaged, targeted audience is more valuable than a large, inactive one.
- Track net follower growth: Monitor not only new followers but also unfollows to understand the true picture of audience growth. This helps identify potential issues with content or engagement that may be driving users away.
- Analyze content performance: Identify which content types or formats drive the most follower acquisition to refine your content strategy and focus on high-performing content.
- Leverage hashtags strategically: Use relevant and trending hashtags to expand your content's reach and discoverability, attracting new followers organically.
- Collaborate with other accounts: Partner with influencers or complementary brands to cross-promote your content and reach new audiences, boosting follower growth.
- Monitor follower quality through engagement: Observe changes in your engagement rate as your follower count grows. A declining engagement rate may indicate an influx of low-quality or irrelevant followers.
By actively monitoring and strategically optimizing your follower growth rate, along with other key social media metrics, you can gain valuable insights into your audience growth and tailor your strategies for greater success. Focusing on consistent, high-quality content that resonates with your target audience is crucial for sustainable follower growth and a thriving social media presence.
8. Social Media ROI
Social Media Return on Investment (ROI) measures the profitability of your social media marketing efforts. It compares the revenue generated from social media activities to the total investment made. This comprehensive metric helps businesses understand the financial impact of their social media strategy and is calculated as (Revenue from Social Media - Social Media Investment) ÷ Social Media Investment × 100. Tracking ROI is crucial for demonstrating the value of social media and justifying continued investment.
Why focus on ROI? Because demonstrating a positive return justifies budget allocation and helps refine strategies for optimal profitability. Learn more about Social Media ROI to further enhance your understanding.
Examples of High ROI
Several business types achieve impressive ROI from social media. E-commerce brands often achieve 300-500% ROI from social media advertising due to direct sales attribution. B2B companies may see 200-400% ROI with longer attribution windows, focusing on lead generation and nurturing. Fashion brands frequently exceed 400% ROI through influencer partnerships, leveraging their reach and audience trust.
Tips for Improving Social Media ROI
- Use UTM parameters and conversion tracking: Accurately attribute revenue to specific social media campaigns and activities.
- Include customer lifetime value: Consider long-term revenue generated by customers acquired through social media, not just initial purchases.
- Track both short-term and long-term revenue impact: Understand the immediate and lasting effects of social media efforts.
- Account for all costs: Include tools, personnel, and advertising spend in your ROI calculations for a complete picture.
- Compare ROI across different platforms and campaign types: Identify high-performing channels and strategies for optimization.
By actively monitoring and optimizing your social media ROI, you can demonstrate the value of your efforts and drive significant business growth.
9. Brand Mention Sentiment
Brand mention sentiment analyzes the emotional tone and attitude expressed in social media conversations about your brand. It categorizes mentions as positive, negative, or neutral. This metric provides valuable insights into brand perception, customer satisfaction, and reputation management needs. Sentiment is typically measured as percentages of total mentions across these three categories. Tracking brand mention sentiment helps you understand how your audience truly feels about your brand, not just how often they mention it. This is critical for identifying areas for improvement and protecting your brand reputation.
Why focus on sentiment? Because it directly impacts your brand's image and bottom line. Positive sentiment can boost sales and brand loyalty, while negative sentiment can quickly escalate into a crisis if left unaddressed. By monitoring sentiment, you can proactively address customer concerns and strengthen your brand's online presence.
Examples of Brand Mention Sentiment
Several brands effectively manage their brand sentiment. Apple, for instance, typically maintains 70-80% positive sentiment despite periodic criticism cycles related to new product launches or pricing strategies. Airlines often struggle with 40-60% negative sentiment during periods of service disruptions or widespread delays, highlighting the volatile nature of this industry and the impact of operational challenges on public perception. Food brands like Chipotle closely monitor sentiment during health incidents or food safety concerns to quickly identify and address potential PR crises.
Tips for Improving Brand Mention Sentiment
- Combine automated sentiment analysis tools with human review: Automated tools provide a starting point, but human analysis ensures accuracy, especially for complex or nuanced language.
- Track sentiment trends over time: Focus on long-term patterns rather than individual spikes or dips in sentiment. This provides a more comprehensive understanding of how sentiment evolves.
- Respond quickly to negative mentions: Addressing negative comments promptly demonstrates that you value customer feedback and are actively working to resolve issues. This proactive approach can prevent sentiment from deteriorating further.
- Use sentiment data to inform product development and service improvements: Negative sentiment can pinpoint areas where your product or service falls short of customer expectations. Use this feedback to make targeted improvements.
- Monitor competitor sentiment: Tracking competitor sentiment provides valuable competitive intelligence, revealing their strengths and weaknesses in the eyes of the public.
By actively monitoring and strategically managing brand mention sentiment, you can protect your brand reputation, improve customer relationships, and gain a competitive edge in the social media landscape. This metric provides essential insights for data-driven decision-making in today's digital world.
10. Social Media Traffic and Referrals
Social media traffic measures the number of website visitors arriving from social media platforms. Referrals, a related metric, track the specific platforms and posts driving this traffic. This combined metric is crucial for understanding how effectively your social media content drives visitors to your owned properties (website, landing pages). Tracking these metrics supports broader marketing objectives like lead generation and sales. It helps assess the ROI of your social media efforts.
Why focus on social media traffic and referrals? Because directing users to your website allows for a more controlled environment to nurture leads and drive conversions. A strong social media presence that effectively drives traffic can significantly boost your overall marketing funnel performance.
Examples of Successful Referral Traffic
Different platforms excel at driving specific types of traffic. Pinterest, a visually-driven platform, drives 25-30% of social media traffic for many e-commerce sites due to its product discovery focus. LinkedIn generates high-quality B2B traffic, often with longer session durations due to its professional user base. While Facebook typically provides the largest volume of social media traffic, it often exhibits lower engagement time compared to niche platforms.
Tips for Improving Social Media Traffic and Referrals
- Use UTM parameters: Implement UTM parameters on all social media links for accurate source tracking in your analytics platform. This allows you to precisely identify which posts and platforms are driving the most valuable traffic.
- Create platform-specific landing pages: Tailor landing pages to match the specific social media platform from which users are arriving. This provides a more cohesive and relevant user experience, increasing conversion rates.
- Track quality metrics: Don't just focus on traffic volume. Monitor quality metrics like bounce rate, time on page, and pages per session to understand user behavior and identify areas for improvement.
- Monitor content performance: Analyze which content types (e.g., blog posts, product promotions, video content) drive the most qualified traffic to optimize your content strategy for conversions.
- Set up goal tracking: Configure goal tracking in your analytics platform to measure how effectively social media traffic converts into desired actions, such as newsletter sign-ups, product purchases, or contact form submissions.
By actively monitoring social media traffic and referrals, and implementing these optimization strategies, you can effectively leverage social media to drive valuable traffic to your website and achieve your marketing objectives.
Key Metrics Comparison for Social Media Performance
| Metric | Implementation Complexity 🔄 | Resource Requirements ⚡ | Expected Outcomes 📊 | Ideal Use Cases 💡 | Key Advantages ⭐ | |-------------------------------|------------------------------------------------|------------------------------------------------|------------------------------------------------|-------------------------------------------------|-----------------------------------------------------| | Engagement Rate | Medium - requires tracking interactions and reach/followers counts | Moderate - data from platforms; some analysis needed | Measures content resonance and audience interaction | Content performance evaluation and optimization | Strong indicator of content quality; enhances algorithm visibility | | Reach and Impressions | Low - basic tracking of unique views and total displays | Low - standard platform metrics | Measures brand visibility and potential audience exposure | Brand awareness and media planning | Essential for measuring visibility; foundational for other metrics | | Click-Through Rate (CTR) | Medium - needs click and impression tracking per link/campaign | Moderate - requires link tracking systems | Measures effectiveness in driving traffic to links or CTAs | Traffic generation and ad/CTA optimization | Direct indicator of content relevance and messaging strength | | Conversion Rate | High - requires conversion tracking and attribution setup | High - integration with sales/leads systems | Measures percentage of visitors completing desired actions | Business impact measurement and ROI justification | Clear link between social efforts and business outcomes | | Social Share of Voice | Medium - requires brand & competitor mention monitoring | Moderate - social listening tools | Measures brand visibility vs competitors in conversations | Competitive intelligence and market positioning | Provides competitive insights; helps identify market shifts | | Customer Acquisition Cost (CAC) | High - tracks all related costs and customer data | High - financial data plus marketing attribution | Measures cost effectiveness of customer acquisition | Budget optimization and ROI for social marketing | Offers financial efficiency insights; helps justify spend | | Follower Growth Rate | Low - tracks follower count changes over time | Low - basic follower data | Measures speed of audience growth | Brand awareness growth and campaign effectiveness | Indicates brand reach expansion potential; useful for benchmarking | | Social Media ROI | High - comprehensive revenue and cost tracking | High - requires integrated tracking and attribution | Measures overall profitability of social media efforts | Executive reporting and budget optimization | Definitive profitability measure; supports strategic planning | | Brand Mention Sentiment | Medium - needs sentiment analysis tools and some human validation | Moderate - social listening with AI and human review | Measures brand perception and customer sentiment | Reputation management and campaign impact assessment | Early warning for reputation risks; informs customer service efforts | | Social Media Traffic & Referrals| Medium - requires web analytics integration with social source data | Moderate - web and social tracking tools | Measures traffic volume and quality from social platforms | Website traffic optimization and lead generation | Identifies best traffic sources; supports conversion tracking |
Elevate Your Strategy: Mastering Social Media Metrics with ViewPrinter
This comprehensive guide has explored ten essential social media metrics you need to track for success: engagement rate, reach and impressions, click-through rate (CTR), conversion rate, social share of voice, customer acquisition cost (CAC) from social media, follower growth rate, social media ROI, brand mention sentiment, and social media traffic and referrals. Each metric offers a unique lens into your audience, content performance, and overall campaign effectiveness. By understanding these metrics and how they interact, you can create a data-driven strategy that fuels significant growth.
Actionable Insights for Data-Driven Decisions
Tracking these metrics is not about collecting vanity numbers. It's about gaining actionable insights that inform your strategy. A high engagement rate might signify resonant content, while a low conversion rate could indicate a disconnect in your sales funnel. Analyzing these metrics in conjunction with each other reveals a more complete picture of your social media performance. This understanding allows you to refine your content, targeting, and overall approach, driving impactful results.
From Data to Optimization: Refining Your Approach
Implementing a data-driven approach is a continuous process of analysis and optimization. Regularly reviewing these metrics helps identify trends, spot opportunities, and address weaknesses. For instance, tracking brand sentiment reveals how your audience perceives your brand, allowing you to proactively manage your online reputation. Similarly, monitoring your CAC from social media ensures you're maximizing your return on investment.
The Power of Integration: A Holistic View of Performance
Connecting your social media activities to tangible business outcomes like conversions and ROI is crucial. This holistic view allows you to demonstrate the value of your social media efforts and secure buy-in for future campaigns. By correlating metrics like website traffic from social media with conversion rates, you can pinpoint which platforms and content types are most effectively driving sales. This targeted approach ensures you're investing resources where they have the greatest impact.
ViewPrinter: Amplifying Your Social Media Success
Mastering these social media metrics equips you with the knowledge to optimize your strategy and achieve your business goals. However, managing multiple platforms and analyzing complex data can be time-consuming. This is where ViewPrinter excels. ViewPrinter is an all-in-one platform for social media content creation, automation, and scheduling. It streamlines your workflow, provides in-depth performance analysis, and empowers you to optimize campaigns across multiple platforms, maximizing your impact and driving tangible results.
Ready to transform your social media strategy into a revenue-generating powerhouse? Explore the power of streamlined content creation, automated scheduling, and in-depth performance analytics with ViewPrinter. Visit ViewPrinter today and discover how you can unlock the full potential of your social media marketing.