Understanding Social Media Analytics: From Data to Growth
Master understanding social media analytics with proven strategies that drive real results. Learn from experts who've cracked the code on data-driven success.
Starting Your Analytics Journey Without The Overwhelm
Imagine a dashboard crammed with numbers. It can feel like trying to read ancient hieroglyphics rather than getting useful information, right? Many people feel overwhelmed when they first start trying to understand social media analytics. Let's clear up the confusion around these metrics and see how they can actually help your business. Let's talk about how to turn data overload into a roadmap for your content strategy.
Think about successful brands. They don't use analytics just to look at past performance. They use it like a compass, pointing them towards new opportunities. This change in mindset is what separates those who just collect data from those who actually grow. It’s not about the numbers themselves; it's about the story they tell. And that story is about your audience, what they do, and what they need.
Overcoming the Vanity Metric Trap
Many marketers get caught in the "vanity metric" trap. They chase likes, follows, and shares, thinking these are signs of real engagement. But a big follower count doesn't always mean a strong community or more sales. In fact, a smaller, highly engaged audience is often better than a huge, passive one. True engagement means real interaction – comments, discussions, and shares that show genuine interest in your brand.
Focusing on the Metrics That Matter
Understanding social media analytics starts with picking the right metrics. This means focusing on engagement, reach, impressions, and conversions. These are the key parts of any successful social media strategy. Think of these metrics like ingredients in a recipe: the right mix creates something really valuable. Imagine baking a cake. A high follower count is like having lots of flour, but without the other ingredients – eggs, sugar, butter – you won’t have a cake. Likes and shares are just one piece of the puzzle.
Consider how huge social media is today. As of April 2025, a whopping 5.31 billion people around the world use social media. That’s 64.7% of the world’s population! This shows the massive scale that social analytics tools have to work with. For more on this huge digital world, check out more insights from DataReportal.
From Numbers to Narrative: The Power of Interpretation
Raw data is only the beginning. The real value comes from understanding the story the numbers tell. This is where many people get stuck, lost in spreadsheets instead of finding useful insights. By learning how to interpret data, you’ll be able to spot trends, understand seasonal changes, and see potential problems before they become big mistakes. This lets you make decisions based on evidence, not guesses. You become a data detective, not just a data collector, allowing you to tell a better story to your audience and get real business results.
The Metrics That Actually Matter (And The Ones To Ignore)
Follower counts and likes can feel good, but they don't always tell the story of your business' success. Truly understanding social media analytics means focusing on metrics that move the needle – the key performance indicators (KPIs) that actually impact your bottom line. Think of them as the key ingredients in a recipe for social media success. You need the right mix to get the results you want.
The Four Pillars of Meaningful Social Media Measurement
Let's break down the four pillars that separate truly effective social media strategies from wasted time and effort:
-
Meaningful Engagement: This is more than just surface-level likes and follows. Real engagement means comments, shares, and conversations – signs that your audience is truly interested in what you're offering. Imagine it as a two-way dialogue, not just you talking at your followers. A smaller, highly engaged audience is often more valuable than a large, uninterested one.
-
Quality Reach: Reaching a huge number of people is pointless if they're not the right people. Quality reach is about connecting with your target audience – the people most likely to become customers or advocates for your brand.
-
Strategic Impressions: Impressions simply tell you how many times your content was displayed. Strategic impressions take it a step further and ask, "Where were these impressions?". Are they appearing in front of your target audience, at the right time and place? That's what maximizes your impact.
-
Trackable Conversions: At the end of the day, your social media efforts should support your business goals. Trackable conversions – things like leads, sales, or sign-ups – connect your social media activity to real, tangible results.
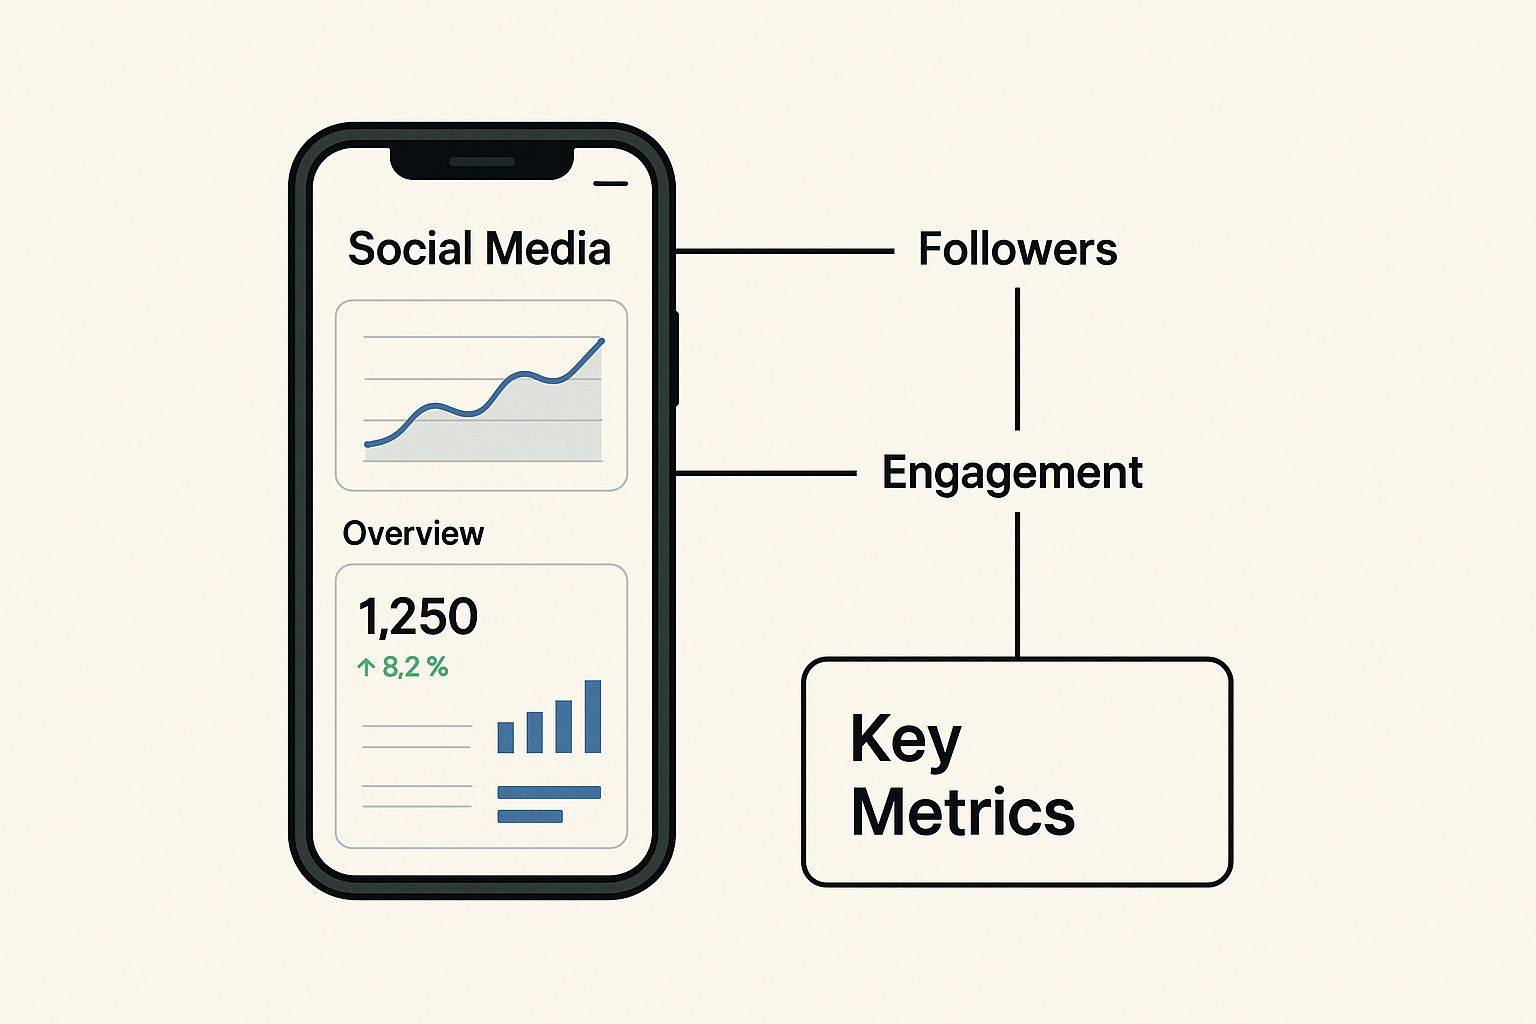
This infographic shows key social media metrics displayed on a smartphone’s analytics dashboard. It visually highlights how crucial tracking these metrics is for understanding your performance and planning your content. The focus on “Key Metrics” reminds us to prioritize data that matters, not just vanity metrics.
Separating Signal From Noise
Many businesses find that "vanity metrics" hide underlying issues. For example, a high follower count might be masking low engagement, suggesting you’re not connecting with your audience. Shifting your attention to quality indicators like engagement rate and conversion rate can completely change your results.
To get a deeper understanding of the specific metrics you should be watching, check out our guide on top social media metrics to track. Knowing which metrics matter most for your business goals is the first step in building a data-driven content strategy. This means learning to recognize real engagement, not just algorithmic noise, and using advanced metrics like sentiment analysis and share of voice to gain a competitive edge.
Before diving deeper, let's take a look at a comparison of these core metrics. The following table summarizes key differences and provides a helpful benchmark range for each.
Core Social Media Metrics Comparison A comprehensive breakdown of essential social media metrics, their purposes, and how to interpret them effectively
| Metric | Definition | What It Measures | Why It Matters | Benchmark Range | |---|---|---|---|---| | Engagement | Interactions with your content | Likes, comments, shares, saves | Shows audience interest and content effectiveness | 1-5% (varies by platform and industry) | | Reach | Number of unique users who saw your content | Potential audience exposure | Indicates brand awareness and content visibility | Depends on audience size and targeting | | Impressions | Number of times your content was displayed | Total potential views | Useful for understanding content distribution | Can be high even with low engagement | | Conversions | Desired actions taken by users | Website visits, sign-ups, purchases | Directly measures impact on business goals | Varies widely based on campaign objectives |
This table clarifies the distinct roles each metric plays in analyzing social media performance. While impressions show potential views, engagement demonstrates true audience interest. Conversions, ultimately, link your social media activity to tangible business results.
By using real-world examples and honest evaluation, you’ll learn how to tell what's valuable from what's not. This lets you make smart decisions based on real data, not just guesswork, and ultimately achieve meaningful results. This focused approach is how you go from simply collecting data to actually understanding it.
Reading Between The Lines: Data Interpretation That Works
The raw numbers you get from your social media activity are really just the beginning. The true power comes from understanding what story those numbers are telling you. That's where understanding social media analytics really becomes essential. Many people get stuck in spreadsheets instead of finding useful insights. We're going to help you shift from simply collecting data to actually becoming a data detective. We'll show you how seasoned marketers find patterns that others miss.
Identifying Trends vs. Fluctuations
Let’s say you’re tracking website visits that came from a social media campaign. A sudden spike in visits might seem great, but is it a real upward trend, or just a temporary blip? Maybe a celebrity shared your post, causing a short burst of traffic. Real trends show continued growth over a period of time, pointing to genuine audience interest. Knowing the difference helps you avoid seeing short-term changes as long-term wins.
Imagine website traffic like waves on a beach. Some waves are big, some are small. A single large wave doesn't necessarily mean the tide is coming in. A true rising tide is seen through a consistent increase in the water level.
Decoding Seasonal Impacts
The time of year has a big effect on social media activity. Think about an online store— they're likely to see more engagement and sales during the holiday season. This doesn’t automatically mean their overall strategy is amazing; it could simply reflect normal consumer behavior. Understanding social media analytics means factoring in these seasonal changes to accurately assess your progress. This allows you to plan campaigns wisely, anticipating busy periods and quieter times.
Recognizing Red Flags
Data interpretation also means spotting warning signs. A steady decrease in engagement, even though you’re posting more often, could point to an issue with your content or the people you’re trying to reach. Ignoring these red flags can lead to wasted effort and missed chances. Catching these early allows you to adjust your strategy, preventing costly errors.
Avoiding the Correlation/Causation Trap
Just because two things happen at the same time doesn't mean one causes the other. For instance, an increase in social media followers might happen alongside an increase in sales. But, other things, like a new product launch or a successful ad campaign, could be the actual reasons for the sales growth. Understanding social media analytics means thinking critically to avoid mistaking coincidences for cause-and-effect relationships. This means developing the ability to see genuine connections, not just things that happen to occur together.
Building a Systematic Approach
Developing a structured way to interpret your data is key. This means:
- Turning observations into hypotheses: See something interesting in your data? Turn it into a testable idea.
- Testing your assumptions: Create experiments to see if your hypotheses are correct.
- Iterative refinement: Continuously look at your data and tweak your approach based on what you learn.
By mastering these skills, you’ll be more confident in the conclusions you draw from your data, letting you make decisions based on evidence, not guesses. This approach, driven by data, leads to more effective social media strategies and helps your business grow. This systematic approach transforms looking at your data from a passive task to an active way to achieve success.
Platform-Specific Strategies That Drive Results
Let's be honest: using the same social media strategy across all platforms is like using the same fishing lure for every type of fish. It just won't work! Each platform has its own unique "ecosystem" – a different audience, different content styles that thrive, and different ways of measuring success. Think about it: an Instagram Story needs a different approach than a long-form LinkedIn article, right? Similarly, TikTok's algorithm-driven visibility creates its own unique path to success.
Understanding the Analytical DNA of Each Platform
So, let's break down the nuances of a few major players. On Instagram, it's all about the visuals. Metrics like engagement rate (likes, comments, shares, saves) and reach show you how much your content resonates. Think of Story views and replies as a quick pulse check on how well you’re connecting with your audience in that fast-paced format.
Now, LinkedIn is a whole different ball game. It's the professional networking hub, so post views, comments, and shares still matter, but you'll also want to keep an eye on article clicks and lead generation metrics, especially if you're using LinkedIn for marketing. Understanding your audience’s professional interests is key here.
TikTok thrives on short, catchy videos and its powerful algorithm. Video views, completion rate, shares, and comments are the vital signs here. Paying attention to trending sounds and hashtags can make a huge difference in getting your content seen.
And then there's YouTube, a powerhouse in its own right. Did you know that YouTube reached a massive 2.53 billion monthly users through advertising in 2025? That's even more than Facebook's 2.22 billion! This really highlights the importance of platform-specific analytics, especially for brands aiming for maximum impact. Want to dive deeper into these stats? Check out the latest social media research here.
Avoiding the Universal Measurement Trap
One of the biggest mistakes is trying to apply the same measuring stick across all platforms. What looks like success on Instagram might not be the same on LinkedIn. For example, a high engagement rate on Instagram is great, but a similar rate on LinkedIn could be even more significant because it's less common. Focusing on platform-specific KPIs (Key Performance Indicators) lets you accurately assess how you’re doing and adjust your strategy accordingly.
Cross-Platform Comparison: Apples and Oranges?
Comparing your performance across platforms can be tricky. It's not as simple as looking at which one has the most followers. Instead, think about relative performance. A lower reach on LinkedIn compared to Instagram doesn't necessarily mean your LinkedIn strategy is failing. It might just reflect the different audience sizes and how people use each platform.
Leveraging Native Analytics Tools
Luckily, each platform offers its own built-in analytics tools that give you valuable information. Instagram Insights, LinkedIn Analytics, TikTok Analytics, and YouTube Analytics all offer data on audience demographics, content performance, and engagement trends. Learning to use these tools is essential for understanding how each platform ticks. This empowers you to refine your strategies and craft content that truly resonates with each specific audience. By understanding the "language" of each platform, you can tailor your approach and maximize your results. It's not about juggling more accounts – it’s about speaking the right language on each one.
Let's take a look at a handy comparison table summarizing key metrics across different platforms:
Platform-Specific Key Metrics
Essential metrics to track on each major social media platform and their unique characteristics
| Platform | Primary Metrics | Unique Features | Best Practices | Common Pitfalls | |---|---|---|---|---| | Instagram | Engagement Rate (likes, comments, shares, saves), Reach, Story Views, Replies | Emphasis on visual content, Stories format for ephemeral content | Focus on high-quality visuals, use relevant hashtags, engage with your audience, track story performance | Inconsistency in posting, ignoring audience feedback, neglecting hashtag research | | LinkedIn | Post Views, Comments, Shares, Article Clicks, Lead Generation Metrics | Professional networking focus, long-form content opportunities | Share insightful content, engage in relevant discussions, build professional connections, track lead generation | Posting irrelevant content, neglecting networking opportunities, not tracking lead generation | | TikTok | Video Views, Completion Rate, Shares, Comments | Short-form video content, algorithm-driven discovery | Use trending sounds and hashtags, create engaging and creative content, focus on completion rate, analyze trending topics | Ignoring trends, neglecting hashtag research, not optimizing for the algorithm | | YouTube | Views, Watch Time, Subscriber Growth, Channel Engagement (comments, likes, shares) | Long-form video content, potential for monetization | Create high-quality, engaging videos, optimize for search, build a community, track watch time and subscriber growth | Inconsistency in uploading, neglecting SEO, ignoring audience engagement |
As you can see, each platform offers unique opportunities and challenges. By understanding these nuances and using the right metrics for each one, you can unlock the true potential of your social media presence.
Tools That Transform Chaos Into Clarity
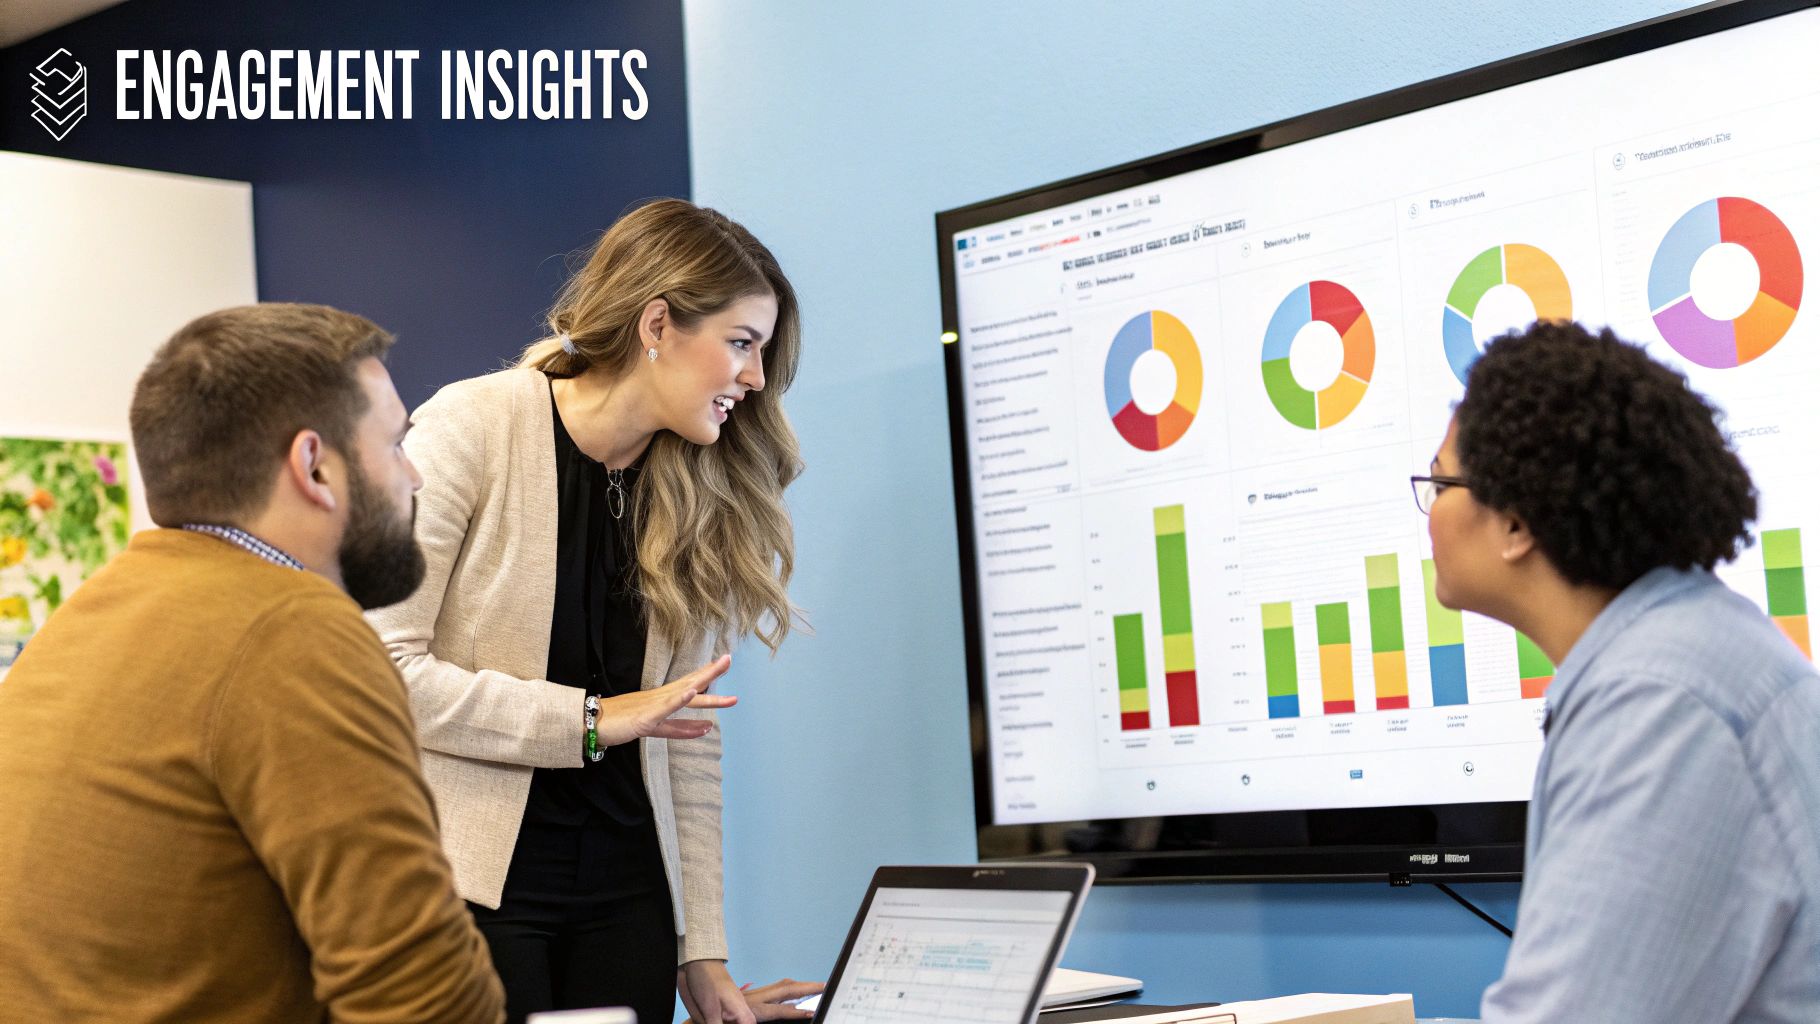
This screenshot gives you a peek at ViewPrinter's analytics dashboard. Notice how it presents key social media metrics in a clear, visual way. You can quickly grasp your performance, spotting important data like engagement, reach, and even audience demographics at a glance. This clear view helps you easily identify trends and areas for improvement in your social media strategy.
So, we've talked about why understanding social media analytics is so important and which key metrics to track. Now, let's explore the tools that can help you gather, analyze, and understand this data. The right tools can be the difference between feeling lost in a sea of data and confidently navigating its insights.
Choosing the Right Tool for the Job
Not all analytics platforms are the same. Imagine having the fanciest, most complex dashboard, but it doesn't tell you what you actually need to know. It's useless! Think about your specific business goals for social media. Are you aiming to build brand awareness, generate leads, or perhaps boost customer retention? Your goals should guide your tool selection.
For example, if getting leads is your main priority, you need a tool that's great at tracking conversions, linking your social media activity directly to the leads you capture. If building brand awareness is your focus, a tool that excels at measuring reach and impressions will be more useful, showing you just how far your message is traveling. Choosing a tool based on your specific needs, not just a long list of features, will ensure you get the information that truly matters.
ViewPrinter: A Unified Approach to Social Media Analytics
ViewPrinter helps you zero in on the metrics that align with your specific objectives. Whether you’re trying to understand your audience or track conversion rates, ViewPrinter provides the data you need to make informed decisions. It does this by presenting those key metrics in a clear, easy-to-understand format, just like in the screenshot above. Plus, ViewPrinter’s automation features can save you hours of manual reporting, freeing up your time for strategic thinking and creative work.
Integrating Your Analytics Ecosystem
Many businesses struggle to combine data from different places. They might be tracking website analytics in one tool, social media analytics in another, and email marketing performance in yet another. This fragmented approach makes it hard to see the whole picture of their marketing efforts. To truly understand how your social media analytics fit into your overall marketing strategy, you need a unified view. This might mean finding tools that can connect with each other or choosing a platform that offers a more complete approach to data analysis.
Beyond the Basics: Advanced Analytics Features
As you get more comfortable with social media analytics, you might want to explore some more advanced features. Competitor analysis tools can give you valuable insights into your competitors' strategies, helping you spot opportunities and potential challenges. Features like sentiment analysis go beyond just numbers and help you understand the feelings behind your audience's interactions, giving you a much deeper understanding of how your brand is perceived.
The goal isn't to become a tools expert. It's to use the right tools to strengthen your understanding of your data and drive real business results. By choosing your tools wisely and focusing on the features that align with your objectives, you can turn data chaos into actionable insights and achieve real social media success.
From Insights To Action: Building Content That Converts

Social media analytics are like a treasure map. They show you where the gold is buried, but it's up to you to do the digging. Simply understanding the numbers isn't enough; you need to use those insights to craft content that truly delivers. This is where data transforms into a powerful content strategy. It's like learning to speak your audience's language fluently and crafting a story they want to hear.
Turning Historical Data into Future Success
The best brands don't just dwell on the past; they use it to shape their future. Think of a clothing store noticing lots of likes and comments on posts about summer dresses in the spring. That tells them something important: people are already thinking about summer fashion. They can then create and schedule more posts around this theme, getting ahead of the curve and meeting customer demand before it even fully forms. This data-driven approach keeps their content calendar perfectly aligned with what their audience wants.
Optimizing Your Content Calendar with Audience Behavior
Understanding your analytics isn't just about knowing what content resonates, it's also about when to share it. Imagine discovering your Instagram audience is most active during weekday lunch breaks. Now you know the perfect time to schedule those engaging Instagram posts for maximum visibility, like delivering a punchline at just the right moment for the biggest laugh.
Creating Repeatable Processes for Content Success
Sustainable success isn't about lucky breaks; it's about building systems. Imagine realizing that video demos of your products get way more engagement than static images. That's a valuable insight you can use to build a repeatable process. Prioritize video creation, invest in high-quality demos, and watch your content strategy consistently deliver. This systematic, analytics-driven approach allows you to scale your efforts efficiently.
Identifying Your Content Sweet Spots
Every audience has its preferences. Think of it like a chef perfecting a recipe. They experiment until they find the perfect blend of spices. You need to do the same with your content. Maybe your data reveals that user-generated content (UGC) performs incredibly well. That's a sweet spot! It tells you your audience loves authentic content from real people. Focus on UGC to create deeper connections and build a strong community.
Understanding the "Why" Behind Audience Behavior
Analytics can uncover the motivations behind your audience's actions. For example, if website traffic from social media spikes after you post a behind-the-scenes look at your company culture, it suggests your audience values transparency. By understanding why they connect with certain content, you can create more meaningful experiences that strengthen their relationship with your brand.
You might be interested in: Check out our guide on content strategy for social media marketing.
Measuring Content ROI: Beyond Vanity Metrics
Ultimately, social media analytics are about measuring the real impact of your content on your business goals. Forget about vanity metrics like follower counts. Focus on what matters: conversion rates. Whether it's leads, sales, or website traffic, track how your social media efforts contribute to your bottom line. This justifies your budget and proves the value of your strategy. It’s not just about creating more content; it’s about creating smarter content, backed by data. By using analytics to inform creative decisions, you strike a balance between artistic expression and data-driven results, ensuring your content resonates with your audience and drives your business forward. This analytical approach fuels sustainable growth and sets you up for long-term success in the ever-changing world of social media.
Proving ROI and Business Impact That Matters
Let's talk about a common challenge for social media marketers: showing how their work contributes to actual business results. This is where understanding your social media analytics becomes crucial. It can be the difference between getting more budget and facing cuts. We're going to explore how to build attribution models, which help track the customer journey from their first interaction on social media to a purchase.
Building Attribution Models That Tell the Whole Story
Imagine a customer sees your product for the first time in a sponsored Instagram post. They don't buy it right then. Maybe later they see their friend share a positive review on Facebook. Finally, they click a link in your email newsletter and make a purchase. Which interaction gets the credit? A simple last-click attribution model would give all the credit to the email, completely overlooking the role social media played in introducing the product and influencing the customer.
Building a solid attribution model means recognizing that customers often interact with your brand multiple times before buying. It's like putting together a puzzle, where each interaction – from social media engagement to email clicks – is a piece that contributes to the final picture: the conversion. This comprehensive view is key to accurately measuring the true value of your social media efforts.
Real-World Examples of ROI Success
Many brands have figured out how to effectively measure their social media ROI. For instance, one company used targeted Facebook ads to promote a new product launch. By tracking unique promo codes used at checkout, they directly tied a 20% sales increase to the Facebook campaign. This clear link between social media activity and revenue is a strong argument for continued investment. Another example is a software company that saw a 15% decrease in customer acquisition cost after using social media to nurture leads. They tracked leads from social media and compared them to leads from other channels, proving the cost-effectiveness of their social media strategy.
You might be interested in: Learn more in our article about how to measure social media ROI.
Measuring What Matters: Lead Quality, Customer Acquisition Cost, and Lifetime Value
Understanding social media analytics goes beyond just sales numbers. It also involves looking at the quality of leads generated through social media. For example, leads who engage with your brand on multiple social platforms before buying often have a higher lifetime value than leads from other sources. This is because interacting on multiple platforms often signals a stronger interest in your brand. Tracking this kind of data helps you focus your social media activities on attracting the most valuable customers.
Addressing Measurement Pitfalls and Building Compelling Business Cases
Sometimes, social media's impact gets underestimated because of flawed measurement. Focusing only on immediate conversions, for example, overlooks the long-term benefits of building brand awareness and community engagement. By shifting your focus to metrics like brand awareness, customer sentiment, and share of voice, you can present a more accurate picture of social media's true worth. This broader view helps build stronger business cases that resonate with stakeholders who are focused on the bottom line. It turns social media analytics from a simple reporting task into a powerful strategic tool. This shift is how you demonstrate the true power of social media, going beyond vanity metrics to showcase its real impact on your business's success.
Your Next Steps: From Understanding To Mastery
Now, let's talk about how to turn your newfound knowledge of social media analytics into a practical plan for long-term success. This isn't just a review; it's your action plan for building a data-driven approach that grows with your business.
Building Your Analytics-Driven Strategy, Step-by-Step
Creating a strong analytics strategy doesn't have to be complicated. Think of it like building a house – you start with the foundation and build up from there.
-
Begin with the basics: Set up simple dashboards in tools like Google Analytics focusing on your core key performance indicators (KPIs), like engagement and reach. These are the basic measurements of your social media performance.
-
Refine your focus: As you get more comfortable, add more specific metrics that match your business goals. For example, if getting new leads is important, track conversion rates—how many people take a desired action, like signing up for your email list.
-
Deepen your analysis: Once you’ve mastered the basics, you can explore more advanced features like sentiment analysis (understanding how people feel about your brand) and competitor benchmarking (comparing your performance to your competition). This gives you a deeper understanding of your audience and the competitive landscape.
Avoiding Common Pitfalls in Your First 90 Days
Just like learning any new skill, there are some common mistakes you'll want to avoid, especially in the beginning:
-
Getting lost in the data: It's easy to get overwhelmed by all the numbers. Focus on the metrics that truly matter for your business goals. Don't get sidetracked by vanity metrics—things that look impressive but don't actually drive results (like follower count without engagement).
-
Ignoring platform differences: Each social media platform is unique. What works on Instagram might not work on LinkedIn. Tailor your analytics approach to each platform’s specific style and audience.
-
Neglecting data interpretation: Raw numbers only tell part of the story. Learn to analyze trends, spot patterns, and draw meaningful conclusions from your data. Think of it like being a detective – you're looking for clues to understand what's working and what's not.
Setting Realistic Timelines and Benchmarks
Don't expect to see huge changes overnight. It takes time to see real results from a data-driven approach. A good timeframe to expect noticeable improvements is 3-6 months.
Set achievable benchmarks based on your current performance and industry averages. For example, if your average engagement rate is 1%, aim to increase it to 2% in the next three months. Small, steady progress adds up over time.
Checklists, Warning Signs, and Milestones for Every Phase
Think of your first 90 days in three phases:
-
Phase 1: Setup (First 30 Days): Connect your social media accounts to your analytics tools, define your core KPIs, and create basic dashboards. Warning sign: Feeling overwhelmed by the initial flood of data.
-
Phase 2: Analysis (Next 30 Days): Start tracking your metrics, identify trends, and try different content formats. Milestone: Finding a clear link between certain content types and higher engagement.
-
Phase 3: Optimization (Final 30 Days): Refine your content strategy based on what you’ve learned, adjust your posting schedule, and test new approaches. Warning sign: Not seeing any improvement in your key metrics even after making changes.
The ultimate goal is to go from simply reporting on social media data to actually driving business growth with a smart social media strategy. ViewPrinter can help you on this journey. Its complete analytics dashboard, along with powerful AI-driven content creation tools, helps you understand your audience, improve your content, and achieve real results. Visit ViewPrinter today and transform your social media presence from a reporting task into a powerful engine for growth.