
How to Measure Advertising Effectiveness
Learn how to measure advertising effectiveness with our guide. Discover the key metrics, tools, and strategies you need to prove your marketing impact.
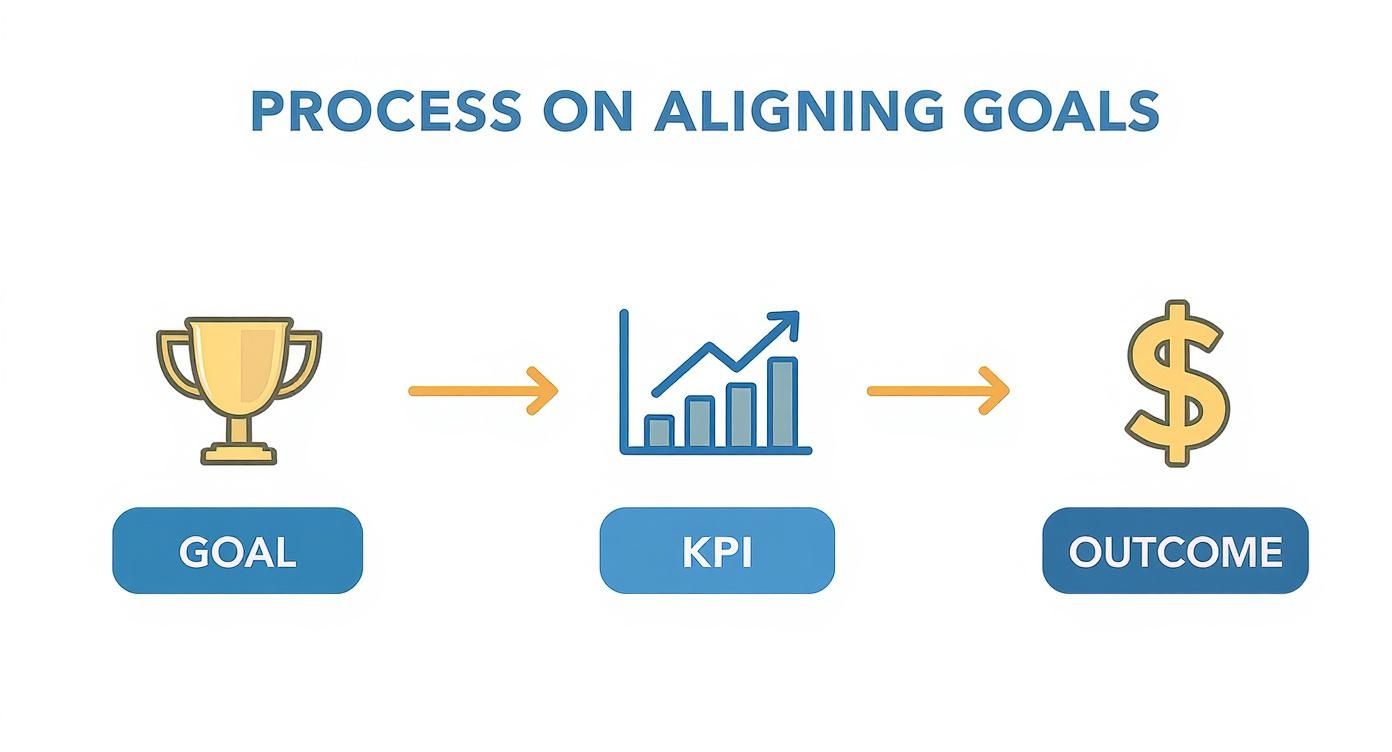
To really know if your ads are working, you need to connect them to what actually matters for your business—things like sales or new leads. It all boils down to tracking the right numbers, like Return on Ad Spend (ROAS) and Cost Per Acquisition (CPA). This is how you make sure you’re measuring real growth, not just chasing metrics that look good on paper.
Aligning Ad Goals With Business Outcomes
Before you even glance at a click or an impression, the most important thing you can do is define what success actually is for your business. Good measurement isn't about hoarding data; it's about collecting the right data that links directly to your bottom line. If you skip this step, you'll end up optimizing for vanity metrics that do nothing for your actual growth.
It starts by ditching vague goals like "brand awareness" and setting concrete, measurable targets instead.
From Vague Goals to Specific KPIs
The metrics you watch depend entirely on what you're trying to achieve. Are you aiming for immediate sales? Generating leads for your sales team? Or are you playing the long game and building brand recognition? Each goal has its own set of KPIs.
For instance, an e-commerce brand running a flash sale needs to be obsessed with Return on Ad Spend (ROAS). The question is simple: "For every dollar we put into ads, how many dollars are we getting back in sales?" It's a straight line to profitability.
A B2B software company, on the other hand, might focus more on Cost Per Acquisition (CPA) or Cost Per Lead (CPL). Their main goal is to get qualified leads into their pipeline at a cost that makes sense. For those using social media, figuring out how to get better at converting social media views into leads is a direct measure of an ad campaign's success and a critical part of this alignment.
To help you get started, here's a quick guide to matching your campaign goals with the right metrics.
Matching Campaign Goals to Core Metrics
| Campaign Goal | Primary KPIs to Track | Example Metric | | :--- | :--- | :--- | | Drive Direct Sales | ROAS, Conversion Rate, Average Order Value (AOV) | $5 ROAS (you make $5 for every $1 spent) | | Generate Qualified Leads | Cost Per Lead (CPL), Lead-to-Customer Rate | $50 CPL for a qualified marketing lead | | Increase Brand Awareness | Reach, Impressions, Video View Rate, Ad Recall Lift | 1M Impressions in the target demographic | | Boost App Installs | Cost Per Install (CPI), In-App Actions, Install Rate | $2.50 CPI |
This table is a starting point. The key is to pick the KPIs that tell you whether your ads are actually helping you hit your specific business targets.
The Bigger Picture Beyond Single Campaigns
Truly effective measurement looks beyond a single purchase. One sale doesn't tell you the whole story. That's where a metric like Customer Lifetime Value (CLV) comes in. It helps you see the total revenue a customer will likely bring in over time, which can justify spending a bit more to acquire the right kind of customer who will stick around. Our guide on how to measure social media ROI digs deeper into this concept.
The goal is to move beyond behavioral and vanity metrics toward a more complete solution. Brands can understand how their message resonates with their target audiences, allowing for more informed decisions when it comes to deciding what kind of data-driven marketing strategies to launch.
With global ad spending projected to hit a staggering US$1.17 trillion by 2025, knowing your numbers isn't just a good idea—it's essential. You need to align sophisticated metrics with clear goals: CPL and conversion rates for sales campaigns, and things like video views or ad recall for awareness plays. When you connect your ad goals to real business outcomes, every dollar you spend has a purpose and contributes to a meaningful result.
Building Your Measurement Tech Stack
To get real insights from your advertising, you need the right tools. We're not just talking about one platform; we're talking about a connected system that follows a customer from the first ad they see all the way to a sale. Without this foundation, you’re just guessing.
The absolute cornerstone of any measurement stack is a solid web analytics platform. For pretty much everyone, that means Google Analytics 4 (GA4). Getting this set up correctly isn't optional—it's how you'll track what people actually do on your site after they click your ad.
Just take a quick look at a standard Analytics dashboard.
This snapshot gives you the high-level story on traffic sources, user engagement, and conversions. It’s ground zero for figuring out if your ads are working.
Beyond Website Analytics
While GA4 tells you what happens on your website, you still need to know what’s happening on the ad platforms themselves. This is where tracking pixels come in—they're tiny snippets of code that bridge the gap.
- Meta Pixel: If you're running ads on Facebook or Instagram, this is non-negotiable. It's how you track conversions and let Meta's algorithm find more people who are likely to buy or sign up.
- LinkedIn Insight Tag: An absolute must for B2B advertisers. This tag gives you incredible data on the professional demographics of your website visitors and tracks conversions from your LinkedIn campaigns.
- TikTok Pixel: Anyone advertising on TikTok needs this. It's the only way to measure your ad impact and build custom audiences based on who's interacting with your site.
These tags are what feed data back to the ad platforms, making their machine learning smarter and your campaigns more effective.
Connecting the Dots with UTMs and CRMs
This is where the real magic happens—tying all the pieces together. UTM parameters are your best friend here. They're just short bits of text you add to your URLs, but they act like little GPS trackers. They tell Google Analytics exactly which campaign, ad set, and ad brought someone to your site. Getting into the habit of using UTMs consistently is one of the single most impactful things you can do for clean, reliable data.
But to get the full picture from click to cash, you need to take one more step: integrate everything with your Customer Relationship Management (CRM) system. This is what creates a true "closed-loop" reporting system.
By connecting ad spend data to actual sales data in your CRM, you can move beyond measuring leads and start measuring what truly matters: revenue. This connection allows you to calculate a precise ROI for each campaign.
Your entire tech stack is there to prove a direct line between the goals you set and the money you make.
The ultimate aim here is to build a system where data flows seamlessly between all your tools. This breaks down the data silos and gives you one single source of truth for your campaign performance. For a deeper look at how to pull all this data together visually, check out our guide on creating a social media analytics dashboard.
When you assemble the right tech stack, you're not just collecting numbers; you're building a machine that helps you make smarter, more profitable advertising decisions.
What Your Advertising Numbers Are Really Telling You
Okay, you've got your tools set up and data is flowing in. Now for the fun part: figuring out what it all means. The real magic in measuring advertising effectiveness isn't just seeing the numbers; it's about translating that raw data into a clear story about your campaign's health.
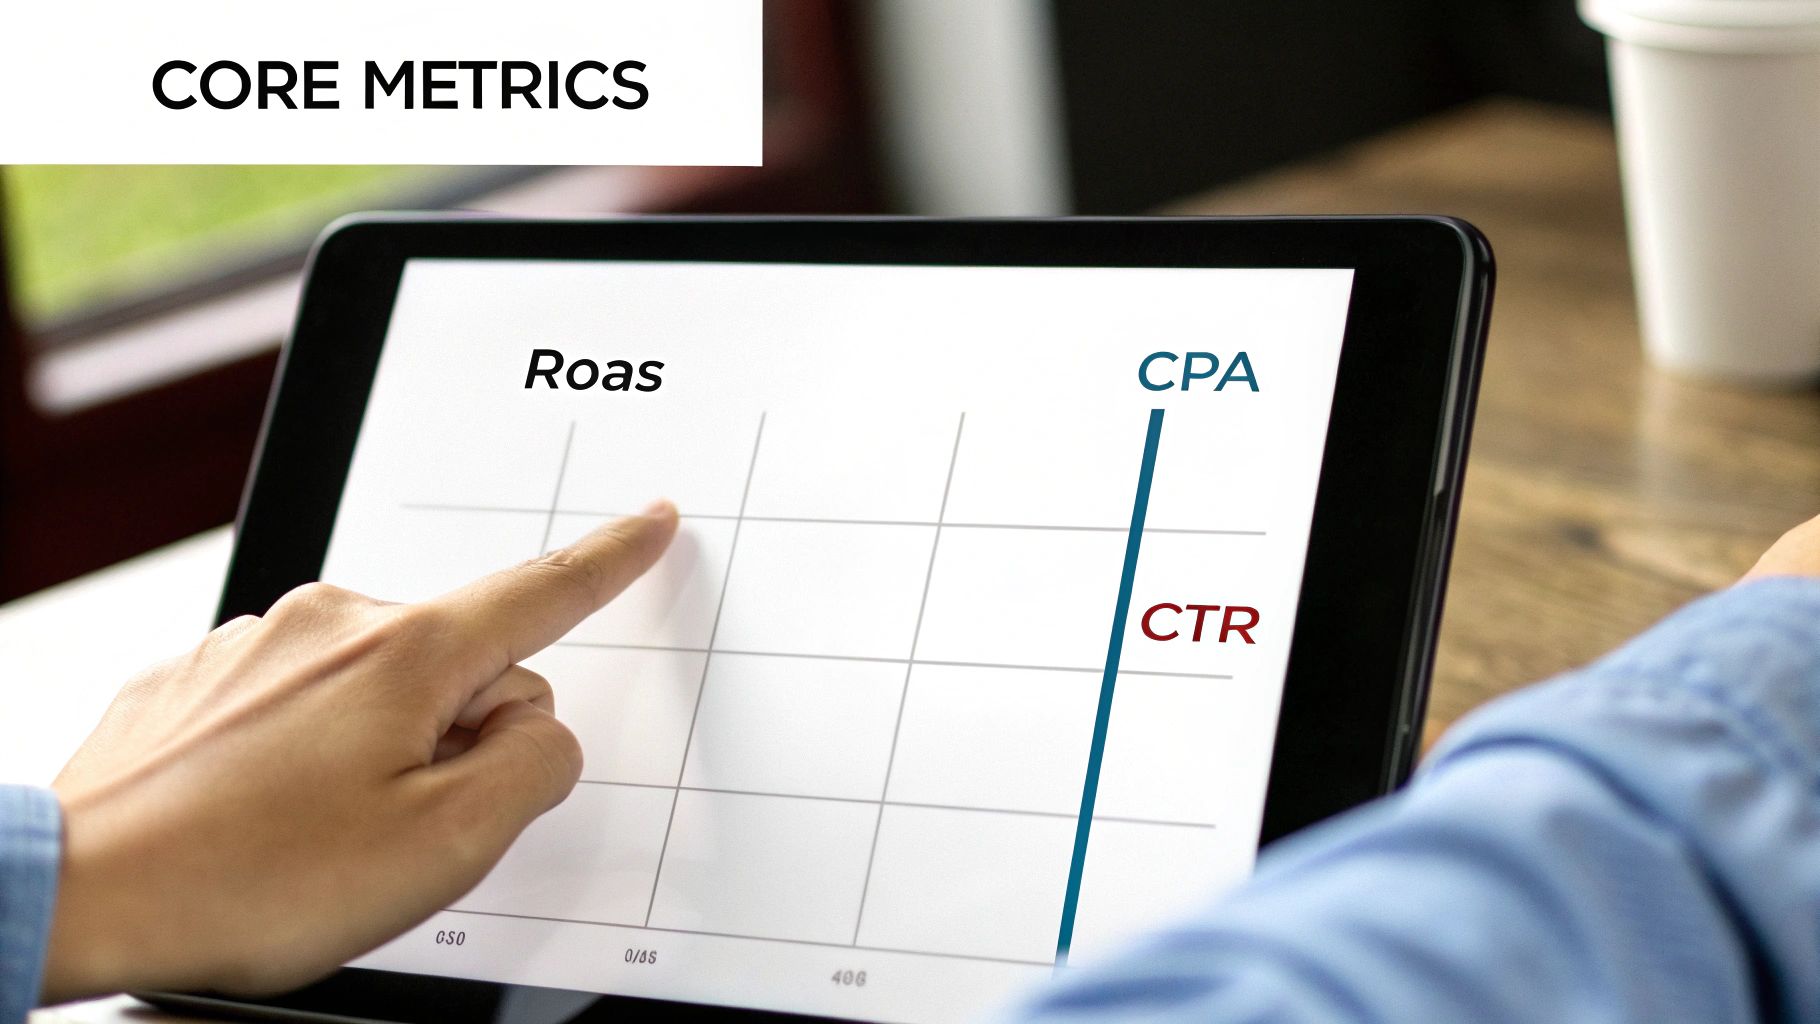
Think of these core metrics as the vital signs for your advertising efforts. Some track profitability, others measure efficiency, and a few tell you if your creative is actually connecting with people. Getting a handle on these is the first real step toward making smarter, data-driven decisions that actually move the needle.
Tying Spend to Profit with ROAS
The most bottom-line metric of them all is Return on Ad Spend (ROAS). It answers the one question every business owner wants to know: for every dollar I put into ads, how many am I getting back? It’s the ultimate report card for your campaign's financial performance.
The math is simple: ROAS = Total Revenue from Ads / Total Ad Spend
Let's say you spent $1,000 on a Google Ads campaign and it brought in $5,000 in sales. Your ROAS is 5:1. You made $5 for every $1 you spent. While a 4:1 ROAS is often thrown around as a good benchmark, the "right" number really depends on your unique profit margins.
Are You Acquiring Customers Efficiently? Check Your CPA
While ROAS is about profitability, Cost Per Acquisition (CPA) is all about efficiency. Sometimes called Cost Per Action, this number tells you exactly how much it costs to win one new customer, generate a lead, or get a sign-up. This is absolutely critical for figuring out your budget and whether you can scale your campaigns without going broke.
The formula is just as easy: CPA = Total Ad Spend / Total Number of Conversions
If you drop $500 on Facebook ads and land 20 new customers, your CPA is $25. Knowing this lets you compare your acquisition cost to your Customer Lifetime Value (CLV) to see if you're building a sustainable business. To get a real grip on what works, you have to define your KPIs, as explained in guides on measuring marketing campaign effectiveness.
At its simplest level, you need to measure what you set out to achieve with your marketing objectives. It's not enough to measure the final outcome alone. You also need to track intermediate metrics to understand where consumers might be getting stuck.
Reading the Room: Audience Engagement
Beyond the money metrics, you need to know how people are actually interacting with your ads. Engagement metrics are often the leading indicators that tell you why your ROAS or CPA is what it is.
Here are the two you can't ignore:
- Click-Through Rate (CTR): This is the percentage of people who saw your ad and were compelled enough to click it. A strong CTR (usually over 2%) is a good sign that your creative, copy, and targeting are all aligned.
- Conversion Rate (CVR): This is the percentage of clickers who followed through and completed the goal (like making a purchase). A low CVR often points to a problem after the click—maybe your landing page is confusing or doesn't match the ad's promise.
These numbers tell a story together. A high CTR but a low CVR is a classic red flag that your ad is writing checks your landing page can't cash. Learning to spot these patterns is key to improving performance over time. To get more ideas on what to track, check out our guide on essential social media metrics to track.
Using Advanced Measurement Models
Once you’ve got a handle on the core metrics, it’s time to go deeper. Basic reports tell you what happened, but the real magic is in understanding the why and the how behind every conversion. That’s where advanced measurement models come in. They help you move beyond simple, last-click credit to see the full, messy, and realistic picture of a customer's journey.
Most advertisers live and die by last-click attribution, which gives 100% of the credit to whatever ad a customer clicked right before buying. It’s simple, sure, but it’s also fundamentally wrong. This model completely ignores every other touchpoint that nudged the customer along—the first social media ad they saw, the brand search they did on Google, or the retargeting ad that sealed the deal.
Exploring Attribution Models
To get a real sense of what’s working, you have to look at different ways of assigning credit. There’s no single "best" model here; the right one really depends on your business and how long it takes for a customer to make a decision.
-
First-Touch Attribution: This one’s simple—it gives all the credit to the very first ad someone ever clicked. It's perfect for figuring out which channels are actually bringing new people into your world and generating that initial spark of awareness.
-
Linear Attribution: This model is the great equalizer. It spreads credit evenly across every single touchpoint in the customer's journey. It’s a fair, balanced way to acknowledge that every interaction played some part, making it a solid starting point for a more nuanced analysis.
-
Data-Driven Attribution (DDA): Now we're getting sophisticated. Available in platforms like Google Analytics, DDA uses machine learning to figure out what really matters. It analyzes the paths of people who converted versus those who didn't, then assigns credit based on which touchpoints were most influential.
The whole point is to stop looking at the customer journey as a straight line. When you experiment with different attribution models, you start to see which of your "top-of-funnel" campaigns are planting the seeds for future sales, even if they aren't getting that final click.
Isolate Your Impact with A/B Testing
Attribution is great for finding correlations, but what if you need to prove causation? If you want to measure the true impact of an ad, nothing beats a controlled experiment. You might know it as A/B testing or split testing.
The concept is straightforward: show an ad to one group of people (your test group) and hide it from a similar group (your control group). By comparing what happens between the two, you can isolate the specific lift your ad generated. Did the test group buy more, sign up for more newsletters, or just remember your brand better?
Digital platforms have made running these kinds of tests easier than ever. That said, it can still be tricky to measure the full causal impact of your ads because of things like selection bias. If you want to go down the rabbit hole, you can discover more research on causal effects in advertising to see just how deep it goes.
Introducing Media Mix Modeling
While attribution models operate within your digital world, Media Mix Modeling (MMM) zooms way out to see the big picture. This is a heavy-duty statistical analysis that helps you understand how all your marketing channels—both online and offline—work together to drive sales.
MMM helps you answer those big, strategic questions, like, "If we pump our TV budget up by 15%, what happens to our online sales?" It even accounts for external factors like seasonality, economic trends, and what your competitors are doing. This is truly the next level of measuring advertising effectiveness.
Turning Insights into Campaign Optimizations

Let's be real: collecting data is the easy part. The real magic happens when you turn those numbers into smarter, sharper campaign decisions. Raw data sitting in a spreadsheet doesn't do a thing for your bottom line. It's the tweaks and pivots you make based on that data that drive actual growth.
The first step is getting a clear view of what's happening. Forget drowning in spreadsheets. A simple, visual dashboard is your best friend here. Pulling your key metrics—like ROAS, CPA, and CTR—into one spot lets you see trends and flag outliers at a glance. It's about spotting opportunities, not getting lost in the weeds.
Segment Your Data to Find Gold
Your audience isn't one big, uniform blob, so stop analyzing your data like it is. This is where you find the gold—by slicing your performance metrics into meaningful audience segments. When you dig in, you start to see patterns that were invisible before.
- Demographics: Are customers aged 25-34 converting at a way higher rate? Maybe your ad creative needs to speak their language more directly.
- Geographics: Is a random city you weren't even targeting bringing in a killer ROAS? Sounds like you just found an untapped market ready for a dedicated campaign.
- Device Type: Is your mobile CPA double what you're seeing on desktop? That's a huge red flag pointing to a clunky mobile landing page that's costing you money.
Breaking down the data like this moves you from making broad guesses to taking precise, informed action.
Implement the Analyze-Hypothesize-Test Loop
Great advertisers don't just "fix" campaigns; they constantly evolve them. This isn't a one-and-done task. It's a continuous cycle of improvement, and the best in the business live by a simple but powerful framework.
- Analyze the Data: Find a weak spot. For example, you notice an ad has a fantastic click-through rate, but almost no one converts on the other side.
- Form a Hypothesis: Create a simple "if-then" statement. "If we change the landing page headline to perfectly match the ad copy, then the conversion rate will go up because it creates a more seamless experience."
- Test Your Change: Don't just make the change and hope for the best. Run a proper A/B test. Send 50% of traffic to the original page and 50% to your new version.
- Measure and Repeat: Once you have enough data, see which page won. Did your hypothesis prove correct? Whether it was a win or a flop, you've learned something valuable. Take that insight and roll it into your next test.
This iterative loop is the engine that drives campaign growth. It turns guesswork into a systematic process, ensuring your advertising effectiveness doesn't just get measured—it gets better.
Got Questions About Ad Measurement? We’ve Got Answers.
Even with the best game plan, you're bound to run into a few head-scratchers when it comes to measuring your ads. It can get complicated, so let's break down some of the questions I hear most often from other marketers.
What’s the Single Most Important Metric to Track?
This is a classic question, but there's no magic bullet. The "most important" metric is always, always tied to your campaign goal. It’s all about context.
- Running an e-commerce store? Return on Ad Spend (ROAS) is your North Star.
- A B2B company chasing leads? You live and die by your Cost Per Acquisition (CPA).
- Just trying to get your name out there with a brand awareness play? You’ll be watching things like reach and ad recall lift.
The trick is to connect your main metric back to the business outcome you wanted from the very beginning.
How Can I Actually Measure Offline Ads?
Measuring print, radio, or TV ads feels old-school, but it's totally doable. You just need to get a little creative and build a digital bridge from your physical ad back to your analytics.
You can use unique vanity URLs (like yoursite.com/tvoffer), dedicated phone numbers, or QR codes that are exclusive to that ad. Another solid strategy is to run brand lift surveys before and after the campaign to see if you moved the needle on audience awareness and perception.
A big part of solving this puzzle is using unified measurement frameworks that blend traditional and digital data. The global Advertising Effectiveness & ROI Measurement market is expected to hit $16.4 billion by 2034, which just goes to show how critical these integrated methods are becoming. You can read the full market analysis on usdanalytics.com.
So, What’s a Good Return on Ad Spend?
Ah, the million-dollar question. The honest-to-goodness answer? It completely depends on your business.
A "good" ROAS isn't a universal number; it's specific to your industry, your profit margins, and your entire business model.
While you'll often hear a 4:1 ROAS ($4 back for every $1 spent) thrown around as a benchmark, it’s not a one-size-fits-all rule. A business with fat profit margins could be thriving at a 3:1 ROAS. On the flip side, a company with razor-thin margins might need a 10:1 ROAS just to turn a profit.
The only way to know what's "good" for you is to calculate your own break-even point first.
Ready to create stunning, high-converting social media ads in minutes? ViewPrinter uses powerful AI to build dynamic slideshows, generate custom avatars, and automate your entire content workflow. Start creating viral content today at viewprinter.tech.